When you look at a Bitcoin price chart, you’re seeing the result of millions of transactions happening on a public ledger. But what if you could see why it’s moving? Not just the price, but the real behavior behind it-whales accumulating, exchanges draining coins, smart money shifting positions before a pump? That’s what on-chain analysis tools do. They turn raw blockchain data into clear signals you can actually trade with.
Forget guessing based on news or tweets. The best traders now rely on what’s happening directly on the chain. Data like wallet movements, exchange inflows, and profit-taking patterns give you a real edge. And it’s not just for pros anymore. Retail traders using these tools are catching moves hours before the crowd. The global market for this kind of analysis hit $1.27 billion in 2023 and is expected to grow to nearly $10 billion by 2030. That’s not hype-it’s demand.
What Exactly Is On-Chain Analysis?
On-chain analysis means looking directly at the data stored on a blockchain. Every Bitcoin or Ethereum transaction is permanently recorded. These tools collect that data-every transfer, every contract interaction-and turn it into metrics you can understand. Think of it like reading the heartbeat of a crypto network.
It’s not just about counting transactions. It’s about spotting patterns. For example, if a large wallet that hasn’t moved coins in years suddenly sends out 500 BTC, that’s a signal. If exchange reserves drop sharply while Bitcoin’s price stays flat, it could mean accumulation is happening off-exchange. These aren’t guesses. They’re measurable behaviors.
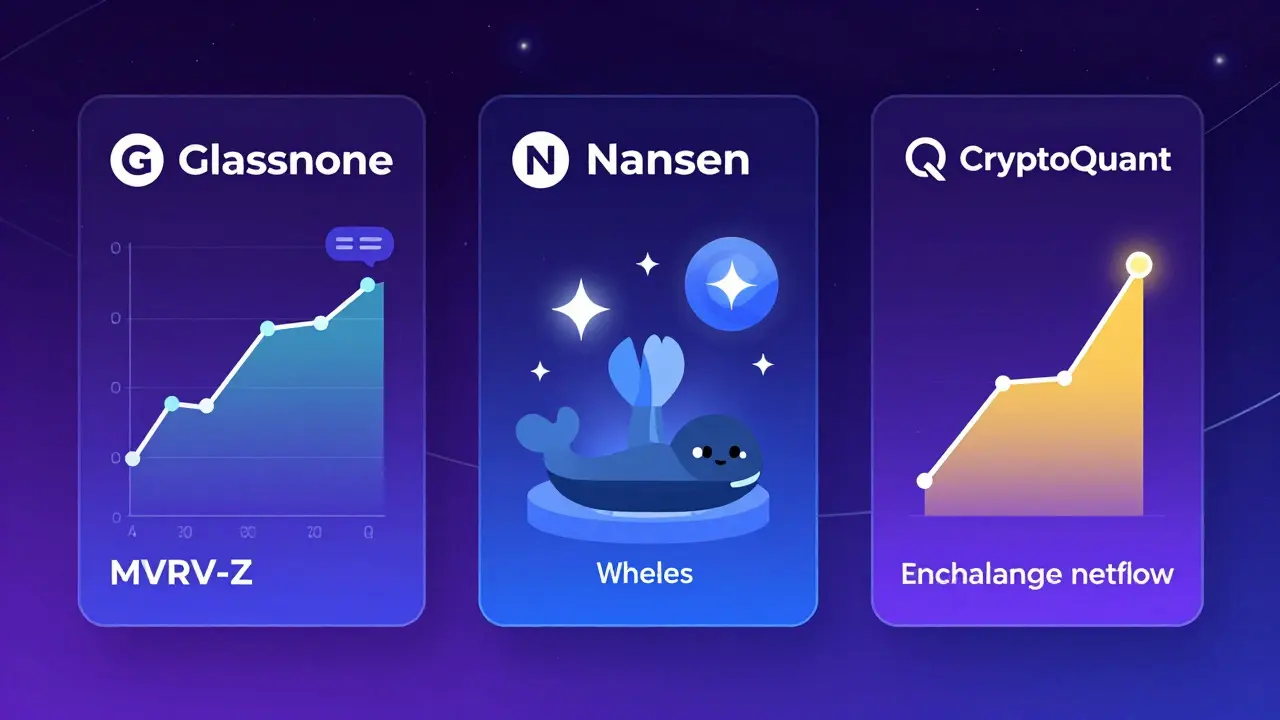
Platforms like Glassnode and Nansen use these signals to create indicators like MVRV (Market Value to Realized Value) and NUPL (Net Unrealized Profit/Loss). These aren’t random numbers. MVRV compares the current market value of all coins to the price they were last moved. When it spikes above 3.5, it often means the market is overheated. When it drops below 1, it’s often a sign of panic selling. These metrics have been backtested across multiple cycles and show strong correlation with price turning points.
Top Platforms Compared: Who Does What Best?
Not all on-chain tools are built the same. Some focus on macro trends. Others track individual wallets. Some are for regulators. Others are for developers. Here’s how the major players stack up in early 2026.
Glassnode: The Institutional Standard
Glassnode launched in 2018 and still leads in fundamental metrics. It tracks over 1.2 billion daily blockchain events across 40+ networks. Its strength? Deep, clean data on long-term trends. Traders rely on its MVRV-Z score to spot market tops and bottoms. In a 2024 survey, 87% of professional traders said it’s essential for cycle analysis.
But it’s not perfect. Glassnode only monitors 15 major exchanges. If you’re trying to track exchange outflows from smaller platforms, you’ll miss data. It also starts at $99/month-no free tier. And while its API is powerful, integrating it takes days. Best for serious traders who want clean, historical metrics without needing to code.
Nansen: The Smart Money Tracker
Nansen is the go-to for tracking who’s moving money. It labels over 180 million wallet addresses-VCs, exchanges, DeFi protocols, even known whales. Its Smart Money feature shows you which wallets have historically bought before big pumps.
One trader on Reddit caught a $SUI pump four hours before it happened because Nansen flagged a labeled VC wallet buying in. That’s the power. Nansen’s AI-powered Cross-Chain Tracker, launched in late 2024, cuts multi-chain analysis from hours to seconds. It’s the most accurate tool for spotting early institutional moves.
Downside? It’s expensive. The Professional tier costs $1,499/month. If you’re a retail trader on a budget, it’s overkill. But if you’re tracking hedge fund activity or early-stage DeFi projects, it’s unmatched.
Chainalysis: The Compliance Giant
Chainalysis isn’t for trading. It’s for law enforcement, exchanges, and regulators. It tracks $17.3 trillion in annual crypto transactions across 100+ chains. Its Reactor tool tags entities like “Mt. Gox Recovery Wallet” or “Rug Pull Scam Contract.”
Over 90% of government agencies use it. That’s why it’s the only platform with full KYC integration. But if you’re trying to find a trading edge, you’ll be frustrated. No free plan. Minimum contract is $50,000/year. And its clustering algorithms sometimes mislabel multisig wallets as exchanges, creating false signals. Vitalik Buterin publicly criticized this in November 2024.
Chainalysis is essential for compliance. Useless for retail traders.
Dune Analytics: The Developer’s Playground
Dune is different. It doesn’t give you pre-built dashboards. It gives you SQL. Anyone can write queries to pull data from Ethereum, Polygon, Arbitrum, and 12 other chains. Over 250,000 public dashboards are shared by the community.
Want to track how many users are staking in a new L2? Build it. Want to see which NFT collection is getting the most wallet activity? Write a query. Dune’s user satisfaction score is 4.7/5-highest in the space. It’s free to start. Thousands use it daily.
The catch? You need to know SQL. 73% of users say it takes 2-3 weeks to get comfortable. If you’re not technical, you’ll feel lost. But if you’re willing to learn, Dune is the most powerful tool on the market. It’s the only platform where you’re not limited by someone else’s filters.
CryptoQuant: The Exchange Flow Expert
If you care about exchange movements, CryptoQuant is your only real option. It monitors 120+ exchanges and 15 mining pools in real time. Its core metric-exchange netflow-tracks how many coins are moving into or out of exchanges.
Founder Ji Young Ju claims exchange netflow combined with funding rates has 89% predictive power for Bitcoin moves within 48 hours. Backtests from Bitcoin Magazine Pro confirm it outperforms Glassnode and Santiment. When exchange reserves drop, it often means coins are being moved to cold wallets-bullish. When they spike, it often means people are selling.
Its interface is simple. No SQL. No labels. Just clean charts. The free tier gives you basic data. Pro plans start at $99/month. Perfect for traders who want one clear signal: are people dumping on exchanges or holding?
Arkham Intelligence: The Entity Graph Leader
Arkham uses entity graph technology to map connections between wallets, exchanges, and protocols. It labels over 1.2 million entities-more than any other platform. Its Intel Exchange lets users buy and sell verified wallet labels, creating a marketplace of intelligence.
It’s growing fast. Institutional adoption rose 300% in 2024. Its AI assistant, launched in November 2024, answers natural language questions like “Show me all wallets linked to Binance that bought SOL in the last week.” Accuracy is around 85%.
But it’s pricey. Minimum plan is $299/month. Retail users rate it low (3.1/5) because of cost. Institutions love it (4.6/5). If you’re running a fund or doing deep due diligence, it’s worth it. For casual traders? Probably not.
What Should You Use? A Simple Guide
Here’s how to pick based on your goals:
- Beginner trader? Start with CryptoQuant’s free tier. Watch exchange netflow. It’s the easiest signal to understand.
- Want to track whales and VCs? Try Nansen’s free plan. You’ll get limited data, but enough to spot big moves.
- Love data and don’t mind learning? Go all-in on Dune. Spend a weekend learning SQL. You’ll unlock more than any other tool.
- Professional trader or fund? Use Glassnode for cycle analysis, Nansen for smart money, and CryptoQuant for exchange flows. Layer them together.
- Working for an exchange or regulator? Chainalysis is your only option. No alternatives.
Most successful traders use 2-3 tools. For example: CryptoQuant for exchange signals, Glassnode for MVRV, and Dune to build custom alerts. Don’t try to use everything. Pick what fits your strategy.

What’s Changing in 2026?
On-chain analysis is evolving fast. The biggest shift? AI. Tools aren’t just showing data anymore-they’re predicting it.
Nansen’s AI now forecasts market sentiment with 40% higher accuracy. Arkham’s assistant answers questions like a human analyst. Glassnode’s On-Chain Health Dashboard combines 12 metrics into a single score that correlates 92% with market mood.
But there are risks. Ethereum’s upcoming Verkle trees (expected Q3 2026) will change how data is stored. Some metrics might become less reliable. Regulators in the EU are also looking at restricting wallet labeling-something Nansen and Arkham rely on.
Also, free tools are getting better. Dune’s community keeps adding new dashboards. CryptoQuant’s free tier now includes real-time exchange data. You don’t need to spend $1,000/month to get valuable insights.
How to Start Using On-Chain Tools Today
You don’t need to be a coder or have a big budget. Here’s how to begin:
- Go to CryptoQuant and sign up for free. Watch the BTC exchange reserve chart. Note when it drops sharply.
- Visit Dune Analytics. Search for “Bitcoin holder distribution.” Open one of the top dashboards. See how many wallets hold more than 1 BTC.
- Try Nansen’s free plan. Look at the “Smart Money” tab. See which wallets have bought before past rallies.
- Set a weekly 15-minute check. Don’t overanalyze. Just watch one or two metrics.
After a month, you’ll start seeing patterns. You’ll notice that when exchange reserves drop and MVRV is below 2, the market often rebounds. That’s not luck. That’s data.
The future of crypto trading isn’t in newsletters or influencers. It’s in the chain. The data is public. The tools are here. The question is: are you ready to use it?
What is the best free on-chain analysis tool?
Dune Analytics is the best free option. It offers full access to SQL queries across major blockchains, with over 250,000 public dashboards you can copy and modify. CryptoQuant also has a robust free tier that includes real-time exchange netflow data, which is critical for spotting short-term price moves. Both are free to start and don’t require credit cards.
Can I use on-chain analysis for altcoins?
Yes, but coverage varies. Nansen, Dune, and Arkham track most major altcoins like Solana, Polygon, and Arbitrum. Glassnode and CryptoQuant focus more on Bitcoin and Ethereum. For newer or low-volume altcoins, you may need to build custom Dune dashboards using on-chain data from block explorers. Always check if the platform supports the specific chain before relying on its metrics.
Do I need to know how to code to use these tools?
No, you don’t. Glassnode, Nansen, CryptoQuant, and Arkham all have user-friendly dashboards that require no coding. Dune Analytics is the exception-it uses SQL, so you’ll need to learn basic queries. But even that isn’t hard. Hundreds of free tutorials exist. You can copy and tweak existing dashboards without writing code from scratch.
Is on-chain analysis reliable during market crashes?
Yes, and often more reliable than traditional indicators. During crashes, on-chain data reveals whether selling is coming from retail (exchanges spiking) or institutions (large wallets holding). For example, if exchange reserves drop during a crash, it often means holders are accumulating-not panicking. This was seen clearly in the 2022 and 2023 bear markets. Data doesn’t lie, even when emotions run high.
How accurate are on-chain predictions?
No tool predicts the future perfectly. But certain metrics have strong historical accuracy. Exchange netflow combined with funding rates predicts Bitcoin moves within 48 hours with 89% accuracy, according to CryptoQuant’s 2024 backtests. MVRV has correctly flagged major tops and bottoms in 7 out of the last 8 cycles. These aren’t guarantees, but they’re the best signals we have. Use them as probabilities, not crystal balls.