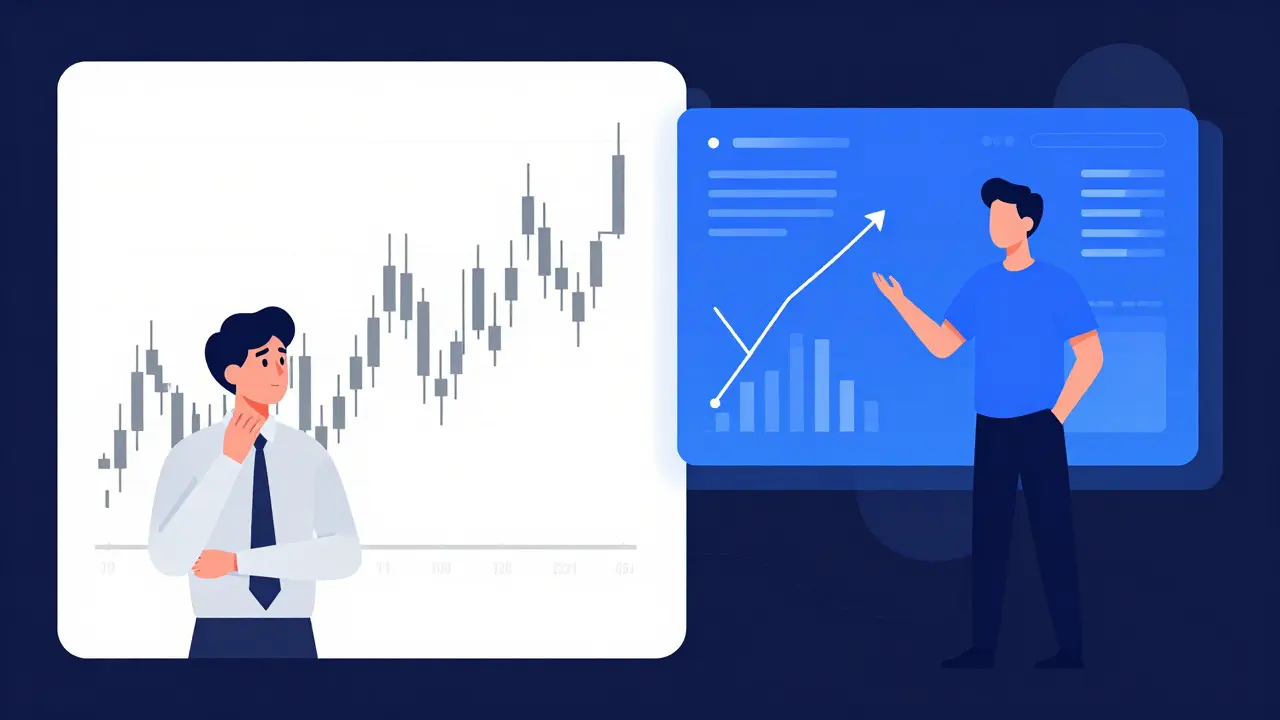
Imagine looking at a crowded room and knowing exactly who is about to leave before they even stand up. That is the promise of on-chain data, which is raw transaction information recorded directly on a blockchain ledger that reveals user behavior, fund movements, and network health before price changes occur. Traditional technical analysis looks at past prices-charts of where the money has been. On-chain analysis looks at the underlying activity-where the money is going right now.
For years, traders relied solely on candlestick charts and moving averages. But in a market driven by sentiment and speculation, price action often lags behind reality. By examining the blockchain itself, you can see if whales are accumulating, if miners are selling under pressure, or if exchanges are seeing massive inflows that signal an impending dump. This guide breaks down how to use these powerful metrics to predict price movements, which tools to trust, and how to avoid common pitfalls.
Why On-Chain Data Beats Traditional Analysis
The core difference between on-chain analysis and traditional technical analysis (TA) is the source of truth. TA analyzes price history, which is a lagging indicator. It tells you what happened, not necessarily why. On-chain data provides leading indicators because it reflects actual economic activity on the network.
Consider the concept of "smart money." Institutional investors and large holders, often called whales, move significant amounts of capital. These moves are visible on the blockchain long before they impact the order books on centralized exchanges. According to a 2023 Delphi Digital report, on-chain analysis now accounts for 37% of institutional crypto trading strategies, up from just 12% in 2020. This shift happened because institutions realized that immutable blockchain data offers a clearer view of supply and demand dynamics than volatile price charts alone.
However, on-chain data is not magic. It requires interpretation. A large transfer isn't inherently bullish or bearish; context matters. Is a whale moving funds to an exchange to sell, or to a cold wallet for long-term storage? Understanding this distinction is the key to unlocking predictive power.
Key Metrics Every Trader Should Monitor
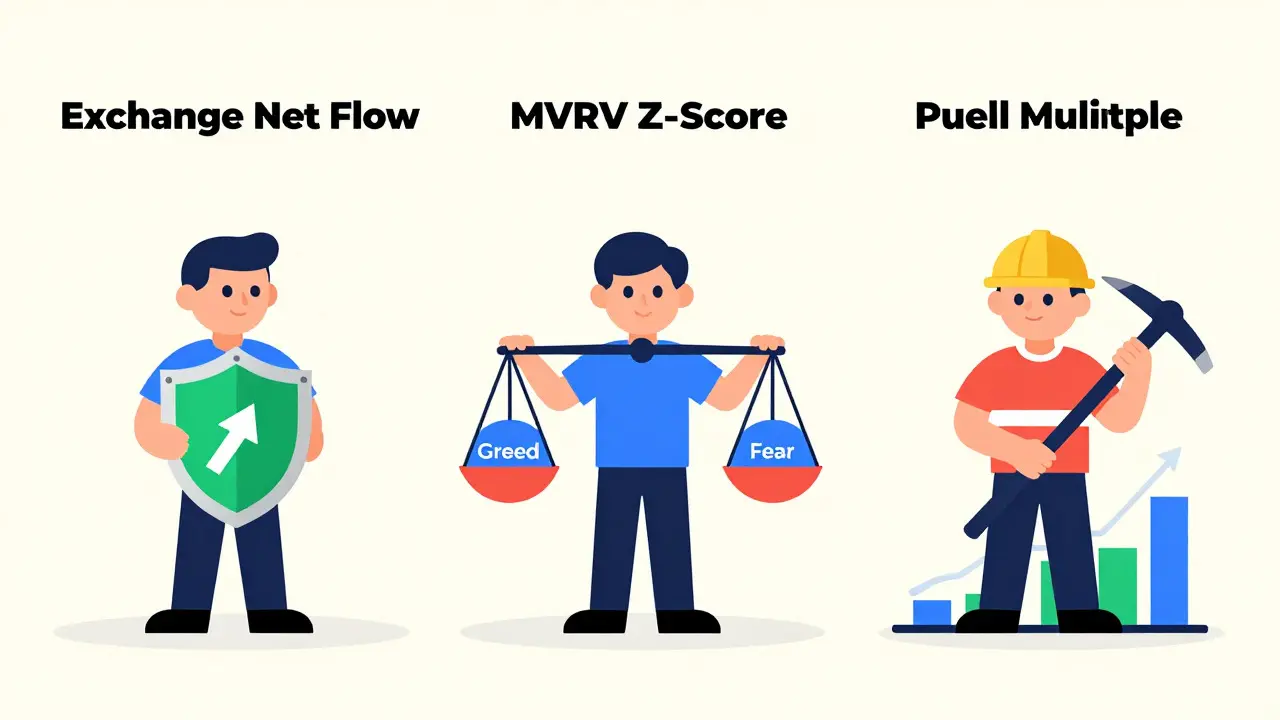
You don't need to track every metric available. In fact, trying to do so leads to analysis paralysis. Focus on these three foundational categories that provide the highest signal-to-noise ratio:
- Exchange Net Flow: This measures the difference between coins flowing into exchanges (potential selling pressure) and coins flowing out (potential holding/investment). A sustained net outflow often precedes bull markets as supply leaves the hands of speculators. Conversely, massive inflows can signal panic or preparation for a sell-off.
- MVRV Z-Score (Market Value to Realized Value): This metric compares the current market cap to the "realized" cap-the value of all coins at their last movement price. High MVRV scores indicate overvaluation (greed), while low scores suggest undervaluation (fear). Dr. Jason Appleton's research showed that combining MVRV with traditional RSI improved prediction accuracy by 32.7%.
- Puell Multiple: Developed by Julian Puell, this tracks miner revenue volatility. Miners are constant sellers who need to cover operational costs. When miner revenue drops significantly below its historical average (low Puell Multiple), it often marks a market bottom because selling pressure diminishes. Willy Woo noted that this metric correctly predicted 9 of the last 10 major Bitcoin turning points since 2016.
These metrics work best when used together. For example, if Exchange Net Flow shows accumulation but the MVRV score is historically high, you might be entering a late-stage bull run rather than the start of one.
Top Platforms for On-Chain Analytics
Accessing raw blockchain data requires robust infrastructure. Most traders rely on specialized platforms that process millions of transactions daily. Here is how the top three providers compare:
| Platform | Best For | Pricing Model | Key Strength |
|---|---|---|---|
| Glassnode | Institutional depth & research | Starting at $1,499/month | 1,200+ metrics, high accuracy address clustering |
| CryptoQuant | Real-time alerts & exchange flows | Tiered subscription | Low latency (1.5s), superior Miner Position Index |
| IntoTheBlock | Retail accessibility & ease of use | Free tier available | Simplified interface, high query volume handling |
Glassnode dominates the institutional space with 43% market share, offering deep historical data and proprietary algorithms. CryptoQuant excels in real-time monitoring, particularly for tracking exchange reserves and miner behavior. IntoTheBlock bridges the gap for retail users with a more accessible interface, though it lacks some of the granular depth of its competitors.
Common Pitfalls and How to Avoid Them
Even experienced traders make mistakes with on-chain data. The most common error is treating metrics as standalone crystal balls. On-chain data must be contextualized within the broader macroeconomic environment.
Nic Carter, a pioneer in the field, warned that ignoring macro factors like Federal Reserve interest rate hikes led many traders to misinterpret healthy accumulation as bearish signals during the 2022 tightening cycle. Another pitfall is the "halo effect," where major external events temporarily decouple fundamentals from price action. During the March 2020 crash, panic selling distorted normal accumulation patterns, making standard metrics unreliable for weeks.
To avoid these traps:
- Combine Metrics: Never rely on a single indicator. Use SOPR (Spent Output Profit Ratio) alongside HODL waves to distinguish between panic selling and strategic profit-taking.
- Understand Timeframes: On-chain signals often lead price movements by 7-14 days. Patience is required.
- Beware of Privacy Enhancements: As protocols adopt privacy features like Taproot Assets or Monero's stealth addresses, data visibility may decrease. Vitalik Buterin estimated that 15-20% of Ethereum transactions could become privacy-enhanced within five years, challenging current models.

Getting Started: A Step-by-Step Approach
If you are new to on-chain analysis, start small. The learning curve typically spans 8-12 weeks for proficiency. Here is a practical roadmap:
- Choose One Platform: Sign up for a free trial or basic plan on CryptoQuant or IntoTheBlock to get comfortable with the interface.
- Master Three Metrics: Focus exclusively on Exchange Net Flow, MVRV Z-Score, and Puell Multiple until you understand their historical correlations with price.
- Backtest: Look at past market cycles (e.g., 2020-2021 bull run, 2022 bear market) and observe how these metrics behaved before major price moves.
- Join Communities: Engage with groups like the On-Chain Wizardry Discord server to discuss interpretations and learn from others' mistakes.
- Integrate Gradually: Start using on-chain signals to confirm your existing strategies rather than replacing them entirely.
Remember, on-chain data is a tool for risk management and timing, not a guarantee of profit. Professional traders spend 45-60 minutes daily monitoring key metrics, according to Messari reports. Consistency beats complexity.
The Future of On-Chain Analytics
The industry is evolving rapidly. AI integration is transforming how we interact with data. Glassnode launched 'NodeMind,' an AI assistant that processes natural language queries with high accuracy, allowing users to ask questions like "Show me whale accumulation trends for the last month" without navigating complex dashboards.
Cross-chain analysis is another frontier. Currently, most tools focus on single chains like Bitcoin or Ethereum. However, capital flows between ecosystems are becoming increasingly important. Platforms are developing beta features to track these inter-chain movements, providing a more holistic view of market liquidity.
Regulatory changes, such as MiCA in the EU, will also shape the landscape. Stricter data handling protocols may increase operational costs for providers, potentially raising prices for retail users. However, standardization efforts by bodies like GFIN aim to improve cross-platform consistency, making data more reliable for everyone.
Is on-chain data better than technical analysis?
On-chain data provides leading indicators based on actual network activity, while technical analysis relies on lagging price history. Studies show that combining both approaches yields higher prediction accuracy (79.3%) than using either alone. On-chain data is superior for identifying market extremes and accumulation phases, but TA remains useful for precise entry and exit timing.
Which on-chain platform is best for beginners?
IntoTheBlock is often recommended for beginners due to its user-friendly interface and free tier. CryptoQuant also offers good educational resources and real-time alerts that are easier to interpret than raw data dumps. Glassnode is more suited for advanced users and institutions due to its complexity and higher cost.
How far in advance can on-chain data predict price movements?
Empirical evidence suggests that on-chain metrics often precede price movements by 7-14 days. Some indicators, like the Puell Multiple, have shown lead times of up to 21 days for major market turning points. However, this varies depending on market conditions and the specific metric used.
Can on-chain data predict altcoin prices accurately?
On-chain metrics are less reliable for altcoins compared to Bitcoin. A 2023 study found that on-chain data explained only 41.7% of price variance for mid-cap tokens versus 68.4% for Bitcoin. This is due to lower liquidity, fewer participants, and greater susceptibility to manipulation and off-chain news events.
What is the MVRV Z-Score and how do I use it?
The MVRV Z-Some compares the current market value of a cryptocurrency to its realized value (the price at which each coin last moved). A high score indicates overvaluation (potential top), while a low score suggests undervaluation (potential bottom). Traders use it to identify extreme greed or fear in the market.