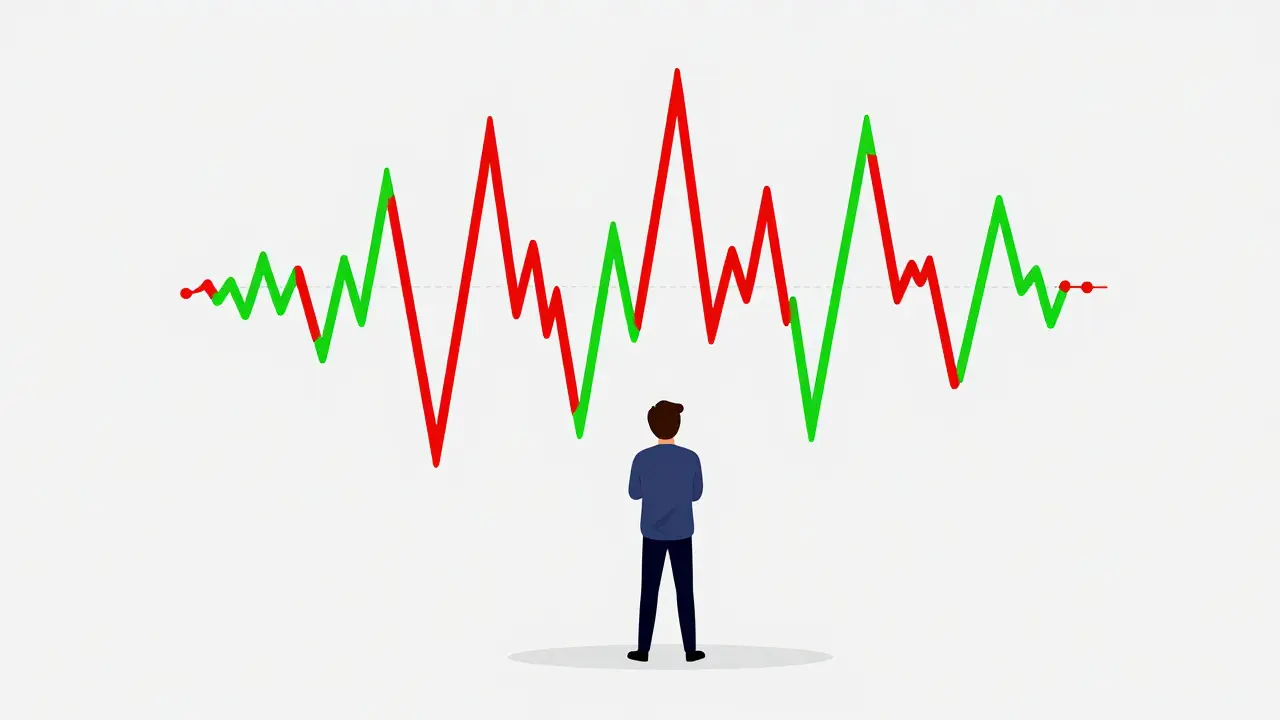
Ever looked at a crypto chart and felt like you were staring at a heart monitor for a caffeinated squirrel? You aren't alone. Whether you're eyeing Bitcoin or some obscure altcoin, the flashing red and green bars can be overwhelming. But here is the truth: these charts aren't just random scribbles. They are visual maps of human psychology, greed, and fear. Mastering how to read crypto trading charts is the difference between gambling on a "gut feeling" and actually having a strategy to grow your portfolio.
Key Takeaways for New Traders
- Candlesticks are King: Most pros use candlestick charts because they show the open, close, high, and low prices.
- Volume is Your Truth Detector: Price movement without volume is often a fake-out.
- Timeframes Matter: A 5-minute chart is for scalping; a daily chart is for investing.
- Patterns aren't Guarantees: Use patterns as probabilities, not absolute promises.
The Basics: Choosing Your Visual Map
Before you start drawing lines, you need to pick the right type of chart. Most platforms, especially TradingView, give you a few options. Let's break them down so you don't pick the wrong one.
The simplest is the line chart. It just connects the closing prices of a coin. It's great for seeing the big picture without the noise, but it hides the "chaos" that happens inside the day. If you want to see the actual battle between buyers and sellers, you need Candlestick Charts. These are the industry standard, used by nearly 90% of intermediate traders. Each "candle" tells a story about a specific time period.
A green candle means the price closed higher than it opened (bullish). A red candle means it closed lower (bearish). The "wicks" or thin lines poking out of the top and bottom show you how high and low the price went before it settled. If you see a long wick on the bottom of a red candle, it means buyers stepped in and pushed the price back up-a huge clue that a trend might be reversing.
| Chart Type | Best For | Pros | Cons |
|---|---|---|---|
| Line Chart | Beginners / Long-term Trends | Clean, easy to read | Lacks detail on price volatility |
| Candlestick | Active Trading / Patterns | Detailed price action | Can look cluttered to newbies |
| Bar Chart | Old-school Technicals | Similar detail to candles | Harder to spot trends quickly |
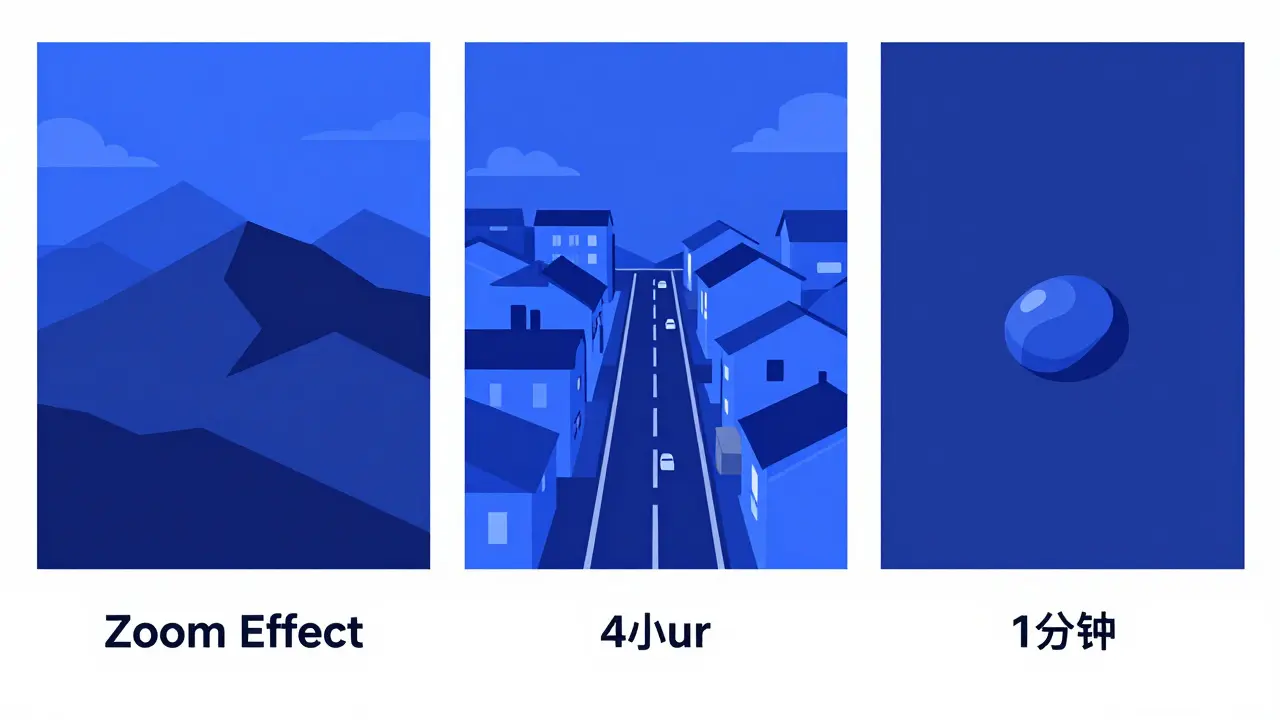
Understanding Timeframes: The Zoom Effect
One of the biggest mistakes beginners make is "timeframe paralysis." They stare at a 1-minute chart and panic because the price dropped 2%, while ignoring the daily chart where the coin is actually in a massive uptrend. Think of timeframes like a map: a 1-minute chart is like looking at a single street; a daily chart is like looking at the whole state.
Professional traders usually use a "top-down" approach. They start with the weekly or daily chart to find the general direction. Then they move to the 4-hour or 1-hour chart to find a good entry point. If you're a long-term investor, the daily chart is your best friend. If you're trying to make quick profits (scalping), you'll spend more time on the 15-minute or 5-minute views. Just remember: the longer the timeframe, the more reliable the signal.
The Secret Ingredient: Volume Analysis
If price is the "what," volume is the "how much." Volume bars sit at the bottom of your chart and tell you how many coins were traded in that period. Why does this matter? Because it confirms if a move is real.
Imagine Bitcoin jumps 5% in an hour. If the volume bars are tiny, it might just be one "whale" manipulating a low-liquidity market. But if that 5% jump comes with a massive spike in volume, it means the whole market is buying in. That's a high-conviction move. In fact, data shows that most sustained rallies are backed by volume increases that are significantly higher than the 20-period average. Never trust a price breakout that happens on low volume-it's often a trap.
Spotting Patterns That Actually Work
Once you can read candles and volume, you can start looking for Chart Patterns. These aren't magic crystals, but they represent repeated human behaviors. They generally fall into three buckets: reversals, continuations, and rhythmic patterns.
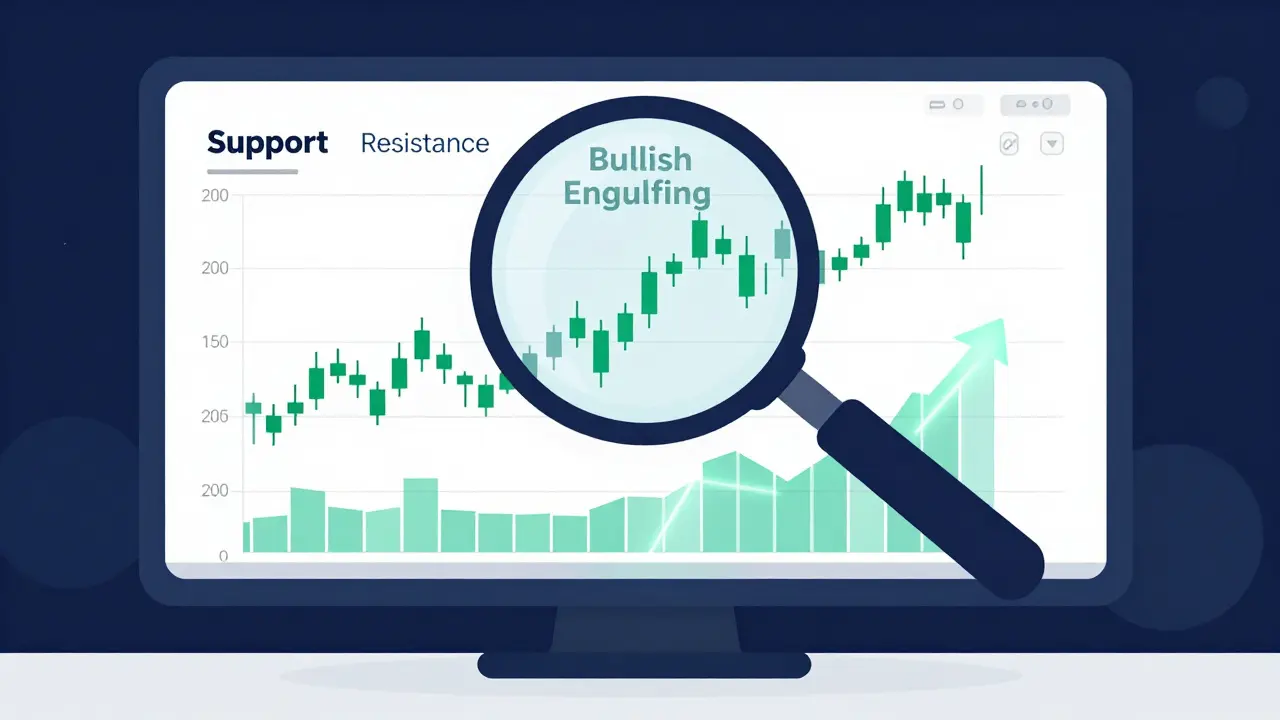
Reversal Patterns tell you the current trend is ending. A classic is the "Head and Shoulders." It looks like three peaks, with the middle one being the highest. When the price drops below the "neckline" of these peaks, it's a strong signal that the bull run is over. Another reliable one is the "Bullish Engulfing" pattern, where a large green candle completely swallows the previous small red candle, signaling a powerful shift toward buyers.
Continuation Patterns, like flags or pennants, suggest the market is just taking a breather before continuing in the original direction. If Bitcoin shoots up and then moves sideways in a small tight range (a flag), it's often gearing up for another leg up.
A pro tip: don't get obsessed with these. In low-liquidity altcoins, these patterns fail way more often than they do on Bitcoin or Ethereum because a few big traders can easily "fake out" a pattern to trick retail traders into buying or selling.
Putting it All Together: A Simple Workflow
You don't need ten different indicators to be successful. In fact, too many indicators usually lead to "analysis paralysis." Instead, try this four-step framework to analyze any coin:
- Determine the Trend: Open the daily chart. Is it moving up, down, or sideways? If it's moving up, you only look for buying opportunities.
- Identify Key Levels: Find "Support" (the price floor where buyers usually step in) and "Resistance" (the ceiling where sellers usually dump).
- Look for a Trigger: Wait for a candlestick pattern (like a hammer or engulfing candle) to form near your support or resistance level.
- Confirm with Volume: Ensure there is a surge in volume accompanying the trigger. If the pattern looks great but volume is dead, stay away.
Keep in mind that crypto markets never close. Unlike the stock market, there is no "opening bell." This means volatility can hit at 3 AM on a Tuesday. Because of this 24/7 nature, you need to be tighter with your stop-losses. A sudden crash can happen while you're asleep, so always have an exit plan before you enter a trade.
What is the best chart for beginners?
Start with line charts to understand the general trend, but quickly move to candlestick charts. Candlesticks provide the most essential data-open, close, high, and low-which is necessary for any real technical analysis.
Do I need to pay for TradingView?
Not necessarily. The free tier is plenty for beginners to learn the ropes. You only need the paid versions if you want more indicators on one chart, multiple layouts, or advanced alert systems.
Can I trust chart patterns 100%?
Absolutely not. Patterns are about probability, not certainty. A "Head and Shoulders" might suggest a drop, but a sudden piece of positive news can invalidate the pattern instantly. Always use a stop-loss to manage your risk.
What is the difference between a linear and logarithmic scale?
A linear scale shows equal price increments (e.g., $10, $20, $30). A logarithmic scale shows equal percentage changes. For assets like Bitcoin that have grown exponentially, log scales are much better because they prevent the chart from looking like a flat line followed by a vertical wall.
Why is volume so important?
Volume acts as a confirmation tool. High volume during a price increase means there is strong institutional or market-wide interest. Low volume during a price increase often suggests a "fake-out" or a temporary pump that could crash quickly.
Next Steps for Your Trading Journey
If you're feeling confident, don't go live with your money immediately. Start by "paper trading"-which is just simulating trades without real cash. Spend a few weeks identifying patterns on the daily chart and see if they actually play out.
If you find yourself getting overwhelmed by too many indicators, strip your chart back to the basics: just candles and volume. Most professional traders find that adding too many tools actually makes them less accurate. Focus on price action first, and then slowly add tools like Moving Averages or RSI as you feel the need for more data.